WXtoImg program allows decode the satellite image by different methods.
What method is the best? To me - I just choose the most attractive picture and placed it to site. May be my method was wrong, may be I lost important information, choosing just attractive picture.
So I propose you select image most informative from synoptic-professional point of view, which I will place to site in addition or instead of images which I placed before.
Below I place images which I got as RAW-file and then process by different methods. Description of image contains method of decode RAW-picture. Note, that some of the images processed with special methods, which allows to see the 3-D picture of ground and clouds, so if you want to see correct image you have to use special glasses, description of image contains description of glasses too.
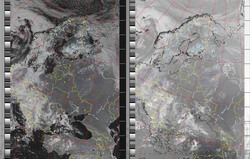 |
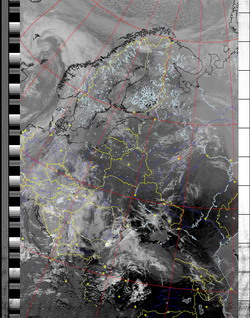
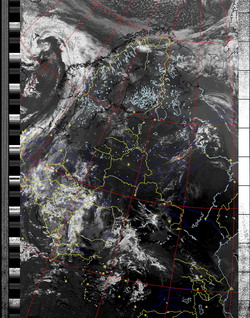
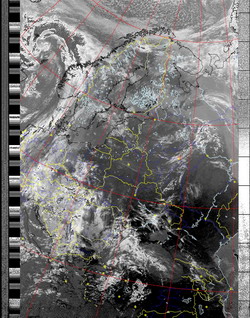
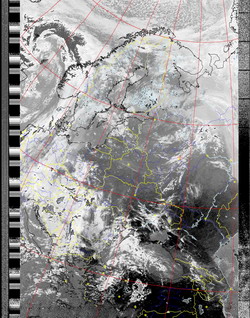
Normal |
Produce a normal image, using Gamma, Sharpening, Despeckling, etc settings. |
|
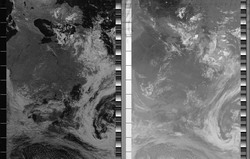 |
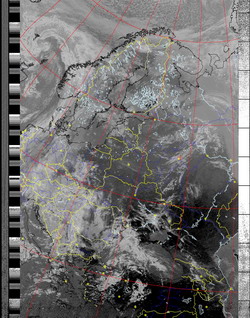
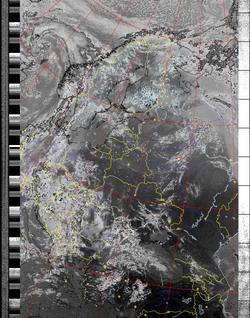
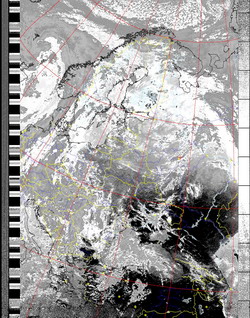
Pristine |
Produce pristine output (best representation of original digital data). Typically used to output images for further processing by other software Pristine images are unenhanced, but unlike raw images have been normalised to produce images which represent, as best as the software is able to, the original digital data. No attempt is made to temperature normalise IR images. Disables gamma, sharpening, rotation, despeckling, and other enhancements. |
|
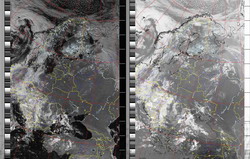 |
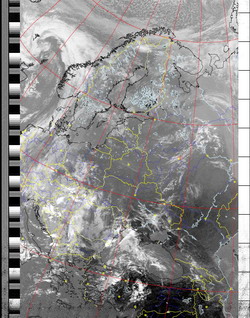
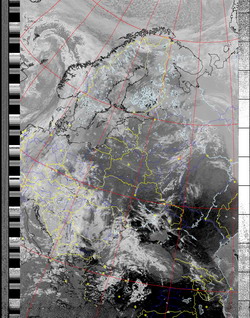
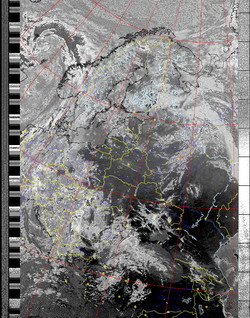
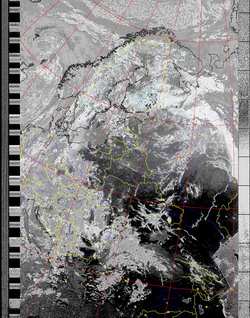
Contrast enhance |
Contrast enhancement is performed as per the Contrast setting in the Options menu. Black and white Creates a black and white image, setting darker pixels to black and lighter pixels to white. |
|
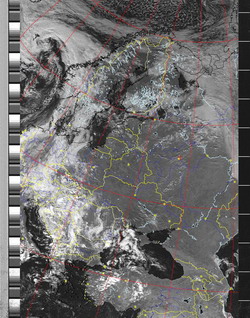 |
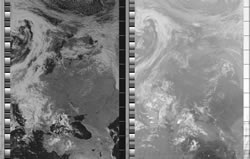
Contrast enhance (NOAA ch A only) |
Contrast enhancement is performed only on the NOAA channel A image as per the Contrast setting in the Options menu. The other image is not shown. |
|
 |
Contrast enhance (NOAA ch B only) |
Contrast enhancement is performed only on the NOAA channel B image as per the Contrast setting in the Options menu. The other image is not shown. |
|
 |
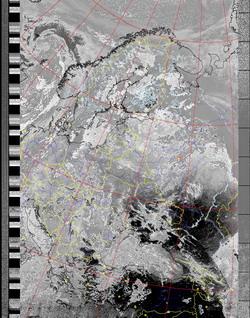
MCIR map colour IR (NOAA) |
Colours the NOAA sensor 4 IR image using a map to colour the sea blue and land green. High clouds appear white, lower clouds gray or land/sea coloured, clouds generally appear lighter, but distinguishing between land/sea and low cloud may be difficult. Darker colours indicate warmer regions. |
|
 |
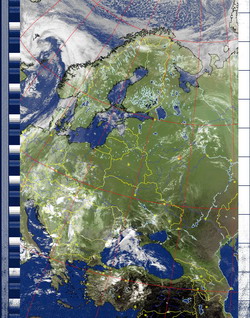
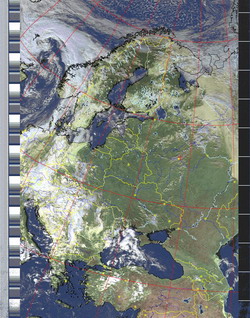
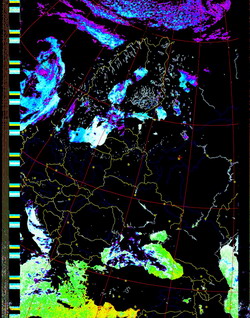
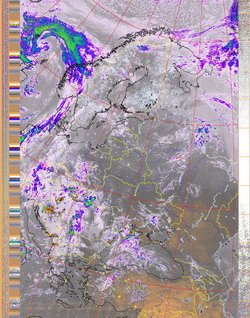
MSA Multispectral analysis (NOAA-# 2-4) |
Multispectral analysis. Uses a NOAA channel 2-4 image and determines which regions are most likely to be cloud, land, or sea based on an analysis of the two images. Produces a vivid false-coloured image as a result. There are several options which affect colouring of these images in Image and Movie Options... under the Options menu. This enhancement does not use a palette nor is it temperature normalised. |
|
 |
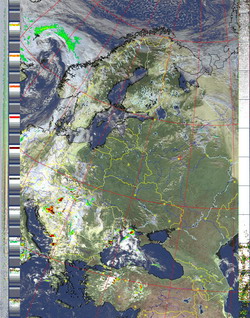
MSA with precipitation (NOAA-# 2-4) |
Same as MSA multispectral analysis, but high cold cloud tops are coloured the same as the NO enhancement to give an approximate indication of the probability and intensity of precipitation. |
|
 |
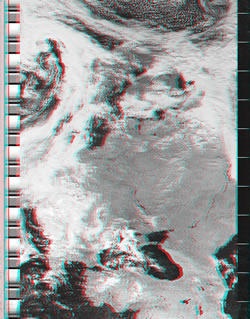
MSA anaglyph false 3-D (NOAA-# 2-4) |
Same as MSA multispectral analysis, but creates a 3-D anaglyph image (must be viewed with red/blue glasses). Operational only if the software has been upgraded. |
|
 |
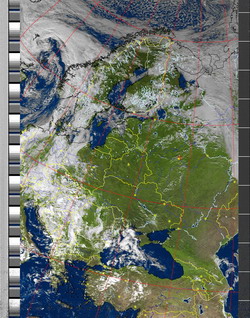
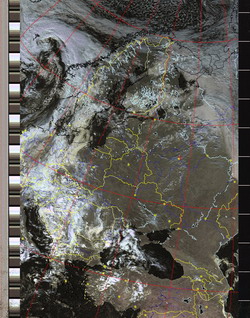
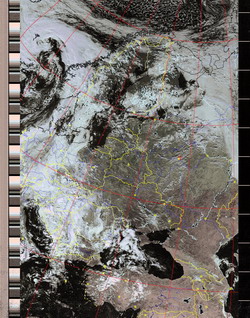
HVCT false-colour (NOAA 2-4) |
Similar to HVC (below), but with blue water and with colours more indicative of land temperatures. |
|
 |
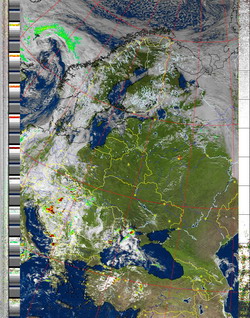
HVCT with precipitation (NOAA 2-4) |
Same as HVCT false-colour, but high cold cloud tops are coloured the same as the NO enhancement to give an approximate indication of the probability and intensity of precipitation. |
|
 |
HVC false-colour (NOAA 2-4) |
Creates a false colour image from NOAA APT images based on temperature using the HVC colour model. Uses the temperature derived from the sensor 4 image to select the hue and the brightness from the visible (sensor 2) image (or the sensor 4 image if the Use other sensor option is selected) to select the value and chroma. The HVC colour model attempts to ensure that different colours at the same value will appear to the eye to be the same brightness and the spacing between colours representing each degree will appear to the eye to be similar. Bright areas are completely unsaturated in this model. |
|
 |
Sea surface temp (NOAA-# 3-4) |
Creates a false colour image from NOAA APT images based on sea surface temperature. Uses the sea surface temperature derived from the sensor 3 and 4 images to colour the image. No attempt is made to distinguish cloud or land from sea. The sea surface temperature may be incorrect due to the presence of thin or small clouds in the pixel evaluated, or from noise in the signal. The sea surface temperature calibration includes knowledge of the specific NOAA satellite. When using this enhancement, the specific NOAA satellite should be chosen from the Satellite menu. The temperature displayed on the status line will use the sea surface temperature algorithm to calculate the temperature only when this enhancement is used. |
|
 |
Daylight sea surface temp (NOAA) |
Creates a false colour image from NOAA APT images based on sea surface temperature. Uses the sea surface temperature derived from just the sensor 4 image to colour the image. This is less accurate than the sea surface temperature derived from sensor 3-4 sea enhancement, but is available when the 3-4 image is not available. No attempt is made to distinguish cloud or land from sea. The sea surface temperature may be incorrect due to the presence of thin or small clouds in the pixel evaluated, or from noise in the signal. |
|
| Not supported on this satellite |
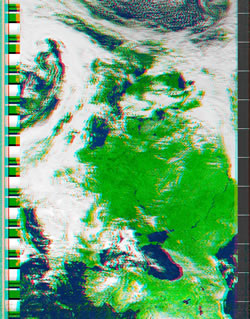
Vegetation (NOAA 1-2) |
Requires the rarely available NOAA APT sensor 1 and 2 images (seen during the test phase after satellite launch). A vegetative index is built up and this is used so that land will be coloured green, water dark blue, and clouds white. No palette is used for this enhancement and the output is not temperature normalised. |
|
 |
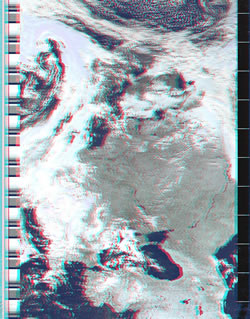
Anaglyph false 3-D (GOES/NOAA) |
Creates a false 3-D image (must be viewed with red/blue glasses) of the visible (sensor 2) image (or the sensor 4 image if no visible image is available) by estimating cloud height. Operational only if the software has been upgraded. |
|
 |
Colour anaglyph false 3-D (NOAA) |
Creates a false colour 3-D image based on the HVCT enhancement (must be viewed with red/blue glasses) using the visible and far-IR images of the NOAA satellite (or just the far-IR image if no visible image is available). Operational only if the software has been upgraded. |
|
 |
Class enhancement (NOAA) |
Unsupervised classification of NOAA APT images using an iterative optimisation clustering algorithm. Uses an initial 27 cluster centres spaced equally along the two-dimensional diagonal. The classification is used to tint the histogram equalised channel A image. |
|
 |
NO colour IR enhancement (GOES/NOAA) |
NOAA colour IR contrast enhancement option. Greatly increases contrast in the darker land/sea regions and colours the cold cloud tops. Allows fine detail in land and sea to be seen and provides a very readable indication of cloud top temperatures. This enhancement option is temperature normalised. |
|
 |
ZA general IR enhancement (GOES/NOAA) |
NOAA general purpose meteorological IR enhancement option. Increases contrast by saturating the very low and very high temperature regions where there is typically very little information. This enhancement option is temperature normalised. |
|
 |
MB thunderstorm (GOES/NOAA) |
NOAA cold cloud top enhancement option. Useful for showing where the strongest rainfall is occurring in thunderstorms. This enhancement option is temperature normalised. |
|
 |
MD warm season MB (GOES/NOAA) |
The NOAA MD enhancement is a modification of the popular, general use MB enhancement scheme. It is intended for warm season use, and provides improved enhancement within the gray "step wedges" that depict "warm top" convection. An additional improvement is better delineation of warm low clouds (30C to 7C). The middle cloud range is somewhat broader than the MB, and enhancement of details is minimised. Otherwise, it is the same as the MB enhancement. This enhancement option is temperature normalised. |
|
 |
BD hurricane (GOES/NOAA) |
NOAA hurricane enhancement option. Highlights certain temperatures in the eye and eye wall of the storm system which are known to be related to the intensity of the hurricane. This enhancement option is temperature normalised. |
|
 |
CC enhancement (GOES/NOAA) |
NOAA CC enhancement curve. This enhancement option is temperature normalised. This option is available only if expert mode is enabled (see Options -> GUI Options). |
|
 |
EC enhancement (GOES/NOAA) |
NOAA EC enhancement curve. This enhancement option is temperature normalised. This option is available only if expert mode is enabled (see Options -> GUI Options). |
|
 |
HE western US (GOES/NOAA) |
The NOAA HE enhancement is used principally by weather offices in the western United States . It provides good enhancement of a wide variety of cloud types, but is somewhat complex, and may be difficult to use at first. It enhances low and middle level clouds common along the Pacific Coast of North America in two separate gray shade ranges. The freezing level is easily determined, an advantage for aviation users concerned with icing. Step wedge regions display very cold infrared cloud top temperatures associated with thunderstorms and frontal systems in 5 degree increments down to -60 C. Two additional "repeat gray" segments define cloud top temperatures colder than -60C. This enhancement option is temperature normalised. This option is available only if expert mode is enabled (see Options -> GUI Options). |
|
 |
HF new western US (GOES/NOAA) |
The NOAA HF enhancement is the most current of the "H" series of enhancements, and is used principally by weather offices in the western United States . It provides good enhancement of low and middle level clouds common along the Pacific Coast of North America . Step wedge regions display very cold infrared cloud top temperatures associated with thunderstorms and frontal systems in 5 degree increments down to -60 C. Two additional "repeat gray" segments define cloud top temperatures colder than -60C. This enhancement option is temperature normalised. This option is available only if expert mode is enabled (see Options -> GUI Options). |
|
 |
JF simple sea surface/cold cloud (GOES/NOAA) |
The NOAA JF enhancement is a hybrid enhancement scheme used to highlight both sea surface temperatures, and cold cloud tops associated with thunderstorms and other weather systems. It is somewhat simpler to interpret than the later JJ enhancement. The coldest portion of the enhancement (less than -33C) is nearly identical to the general-use MB enhancement. Maximum enhancement is provided at the warm end (25 to 10C) to depict sea surface temperatures and warm low clouds in tropical and sub-tropical areas. This enhancement option is temperature normalised. This option is available only if expert mode is enabled (see Options -> GUI Options). |
|
 |
JJ sea surface/cold cloud (GOES/NOAA) |
The NOAA JJ enhancement is used to highlight both sea surface temperatures, and cold cloud tops associated with thunderstorms and other weather systems. Maximum enhancement is provided at the warm end (23 to 0C) to depict sea surface temperatures and low clouds. The presence of a freezing level break point is important for aviation users interested in icing conditions. Multiple, steep, ramp enhancement ranges provide considerable detail within cold cloud tops such as thunderstorms, but it is difficult to determine the actual temperatures with any accuracy. This enhancement option is temperature normalised. This option is available only if expert mode is enabled (see Options -> GUI Options). |
|
 |
LC fog/low cloud/precip (GOES/NOAA) |
The NOAA LC curve is used on images from the 3.9 micron shortwave infrared channel (CH2) of GOES. It provides maximum enhancement in the temperature range where fog and low clouds typically occur (36C to -9C). Another enhanced thermal range is from -10C to -29C, the region of precipitation generation in mid-latitude weather systems. Since CH2 is sensitive to "hot spots," a steep, reverse ramp is found at the warm end (68C to 50C) to show any observable fires as white. There is no enhancement at the very cold end (-30 to -67C), due to the instrument noise normally present at these temperatures. This enhancement option is temperature normalised. This option is available only if expert mode is enabled (see Options -> GUI Options). |
|
 |
TA enhancement (GOES/NOAA) |
NOAA TA enhancement curve. This enhancement option is temperature normalised. This option is available only if expert mode is enabled (see Options -> GUI Options). |
|
| Not supported |
WV water vapour (GOES/NOAA) |
The modified NOAA WV curve is used for the 6.7 micron water vapor channel (CH3) on GOES. The only temperature range that is enhanced is between -5C and -90C. Temperatures colder than -90C are shown as white, and temperatures warmer than -5C are displayed as black. This enhancement option is temperature normalised. This option is available only if expert mode is enabled (see Options -> GUI Options). |